Electricity markets
Understanding the European Electricity Market
An accessible guide to the European electricity market, from market participants and coupling to day-ahead trading, intraday trading, balancing, and zonal prices.
Power markets play one of the most fundamental roles in our society. They must ensure all consumers receive electricity uninterruptedly in an economically sustainable manner while meeting an ever-growing demand. They integrate several energy sources with distinct behaviour, different demand profiles, seasonality, face social events and geopolitical disruptions, and coordinate many parties across extensive regions. As one can imagine, this is not easy.
As a result of this complexity, most of society struggles to grasp what their electricity bill even means and how prices are defined. It is understandable. This post aims at shedding some light into the European Power Market. I focus particularly on the different roles, the interfaces among parties, and timings, as I believe this is the key to untangle the mystery of how power prices are decided.
Definitions & Key Players
Understanding the jargon that surrounds the Energy and Power Markets is arguably one of the most difficult barriers to entry. There are so many intertwined parties, roles, responsibilities, and subtle details, that any outsider reading about this topic can feel lost within seconds. If you are an expert, then this section might be superfluous and you can skip it.
To avoid this common pitfall, I think it is best to define some key concepts before explaining how the European Power Market works. The goal of these definitions is to be understandable to a vast majority, sometimes at the expense of full correctness. However, it is totally normal if after reading this section you still do not completely understand who is who. In my personal experience, it takes a bit of back and forth between reading definitions and market explanations to get a somewhat decent understanding of the power market.
Participants A participant is any entity that submits an order that will enter the power market decision-making. It refers to anyone that can buy power, sell it, or even do both. Utilities selling power to customers like us and generators producing it are normally the participants that first come to mind. However, there is a wide range of participants that might be interested in taking part in the power market. Table 1 provides a non-exhaustive list of participants:
| Participant | Description |
|---|---|
| Generating utility | Produces power and sells it, although may also buy it to cover an outage or optimize a portfolio if it is part of an industry conglomerate. |
| Retail electricity supplier | Buys electricity to meet the forecasted consumption from its customers. |
| Large industrial consumer | Buys its expected demand. Many of these industrial consumers have agreements with intermediary companies that guarantee an average price over a fixed period of time. |
| Energy trader or commodity merchant | Buys and sells across periods, zones, and markets. They normally do not possess any asset and need to cover their positions to be net zero in power generation and consumption. |
| Bank or financial institution | Similar to traders. These might trade physical spot electricity if it satisfies exchange, clearing, collateral, and balance-responsibility requirements. |
| Aggregator or virtual power plant | Aggregates distributed generation, batteries, flexible loads, or demand response |
| Battery or pumped-storage operator | Companies that buy when charging and sell when discharging. They take advantage of their storage flexibility to arbitrage the market, as they do not need to be net-zero as the energy traders and financial institutions at the end of the day. |
| Municipality, cooperative, or public utility | Buys for customers and/or sells local generation |
| TSO or DSO | May buy electricity for network losses or specific operational purposes, depending on national arrangements |
| Market maker | Posts buy and sell interest to provide liquidity, while remaining responsible for its resulting physical position |
Order Order is a general term that refers to both bids and offers. They are bids that a participant submits to a NEMO indicating its willingness to buy or sell physical electricity. This is important, orders are not financial products, they bind whoever submitted it to deliver physical energy at the agreed location, time, and price, if the order is approved after price clearing. If generation or consumption are not possible, then the participant must cover its position by selling or buying the opposite position.
Let's say that a financial institution submits an order, either buying or selling power. If after EUPHEMIA completes the centralized electricity market optimization, this order is accepted, this participant is forced to deliver or receive power. However, financial institutions do not have the capacity to do either. Therefore, they usually cover their position before actually delivering or receiving this energy. In this context, covering a position means doing the opposite of what was done so the net result is zero. For instance, if a financial institution first bought 1 MWh, it must sell 1 MWh to another participant that can actually use that energy before the time when the order expires.
Bidding zone Geographic market area that is characterized by uniform prices at every MTU, buy and sell orders are constrained to this region without cross-zonal exchanges within the zone, and exports and imports of electricity are considered by the TSO and the optimization. In other words, they are the geographical regions in which the land is divided for electricity market purposes and that have a shared price within the zone, having only cross-zonal exchange across its borders.
SDAC: Single Day-Ahead Coupling SDAC(opens in a new tab) is the official, pan-European operational framework that relates the distributed European power markets. It is not an institution or body, but a set of rules and structure mandated by the European Union that sets the field for the different NEMOs and how they must operate.
The main goal of SDAC is to create an environment where NEMOs from different geographical locations and TSOs work together in a cross-zonal day-ahead electricity market. With this framework, cross-border exchanges, capacity transmission limitations, and other interconnections are considered, so different electrical systems can be connected, fostering exchanges and competition while increasing energy utilization and efficiency.
In summary, the SDAC is the game that NEMOs play. It defines the arena and the rules, and the NEMOs and TSOs provide the information and coordination for all participants. EUPHEMIA is the cornerstone where this information is combined centrally, leading to the clearing prices and cross-zonal exchanges of the day-ahead market.
SIDC: Single Intraday Coupling SIDC(opens in a new tab) is the counterpart to SDAC in the intraday market. It is a European framework operated by the NEMOs and TSOs that sets the trading rules of the intraday market and coordinates the cross-zonal exchanges among bidding zones. Both the SDAC and SIDC consist of a price-making mechanism based on auctions. However, the SIDC also includes the continuous intraday trading mechanism, which does not require auctions to take a position.
NEMO: Nominated Electricity Market Operator NEMOs(opens in a new tab) are the physical entities responsible for managing the energy trading in the day-ahead and intraday markets. Together with the TSOs, they are one of the two pillars of the European Power Market.
NEMOs are designated market operators by national authorities. For the day-ahead market and the intraday auctions, they collect orders from different participants, anonymize them, pool them together in a central, single, master calculation, and run the power pricing optimization with EUPHEMIA. Therefore, the price calculation is fully centralized in a pan-European optimization. This calculation is also organized and coordinated by several grouped NEMOs. For the continuous intraday trading, NEMOs transfer orders to the Shared Order Book.
There are several NEMOs operating in SDAC and SIDC. In bidding zones with more than one active NEMO, participants may choose which one to use. This choice does not change the zonal clearing price because the NEMOs' orders enter the same coupled calculation. Table 2 lists the NEMOs currently involved in SDAC and the bidding zones in which their day-ahead data are published.
| NEMO | Current SDAC bidding-zone footprint | Market structure in its home market |
|---|---|---|
| BRM(opens in a new tab) | Romania | Competitive |
| BSP SouthPool(opens in a new tab) | Slovenia | Competitive |
| CROPEX(opens in a new tab) | Croatia | Competitive |
| EPEX SPOT(opens in a new tab) | Austria, Belgium, Denmark, Finland, France, Germany-Luxembourg, Netherlands, Norway, Poland and Sweden | Competitive / passported across several markets |
| EXAA(opens in a new tab) | Austria, Belgium, France, Germany and Netherlands | Competitive / passported across several markets |
| GME(opens in a new tab) | Italy | National monopoly |
| HEnEx(opens in a new tab) | Greece | National monopoly |
| HUPX(opens in a new tab) | Hungary | National monopoly |
| IBEX(opens in a new tab) | Bulgaria | National monopoly |
| Nord Pool(opens in a new tab) | Austria, Belgium, Denmark, Estonia, Finland, France, Germany-Luxembourg, Latvia, Lithuania, Netherlands, Norway, Poland and Sweden | Competitive / passported across several markets |
| OKTE(opens in a new tab) | Slovakia | National monopoly |
| OMIE(opens in a new tab) | Portugal and Spain | National monopoly |
| OPCOM(opens in a new tab) | Romania | Competitive |
| OTE(opens in a new tab) | Czech Republic | National monopoly |
| SEMOpx(opens in a new tab) (EirGrid and SONI) | Ireland and Northern Ireland | Competitive |
| TGE(opens in a new tab) | Poland | Competitive |
Sources: NEMO Committee's current SDAC participants and published bidding-zone footprints(opens in a new tab) and ACER's June 2026 list of designated NEMOs(opens in a new tab).
TSO: Transmission System Operator Entity responsible for operating the electricity grid, particularly the high-voltage sections. Their role is to operate, maintain, and develop the grid. TSOs are fundamental in power markets, as they have the overview of the grid status and provide the cross-zonal capacity as a constraint to the electricity price calculations.
The cross-zonal capacity considers the safety, operability, and limitations of the grid. It limits how much power can flow in a specific region at a determined time, and shares this information with the NEMOs so they can consider if cross-border trades between regions are feasible considering the grid capacity. As we will see later, this has a big effect on the clearing price.
MCO: Market Coupling Operator This is a regulatory and operational function, not a physical entity. The MCO is integrated by all NEMOs, and has the responsibility of handling all data linked to the day-ahead coupling calculations (TSOs cross-zonal capacities, allocation constraints, and anonymized orders), maintaining and running the infrastructure, and performing the electric market optimization with EUPHEMIA. The MCO also communicates the results back to the relevant NEMOs, which subsequently transfer them to their participants. In summary, the tasks for the MCO span three ranges:
Before Price Coupling: the MCO collects all anonymized orders from the NEMOs, and collects the cross-zonal capacities and allocation constraints from the TSOs.
Price Coupling: combines the data from NEMOs and TSOs to form the optimization problem and runs EUPHEMIA.
After Price Coupling: shares results with NEMOs and scheduled cross-zonal exchanges with TSOs.
The MCO function also handles the same kind of operations for the intraday market, although the intraday calculations differ from those for the day-ahead market.
MTU: Market Time Unit It is the standard time unit that defines the interval over which electricity is traded. In the European Power Market, the MTU is 15 minutes. This means that the minimum commitment that a participant must take when buying or selling electricity lasts 15 minutes. The MTU defines the minimum time interval, but it is possible to submit block orders that span over several hours. This MTU applies to both the day-ahead and intraday markets.
PCR: Price Coupling of Regions Technical consortium that co-owns, manages and maintains EUPHEMIA and the PMB software. It is a subgroup of NEMOs that originally started the initiative of having a central system to integrate the different power markets in Europe. The members of PCR are: EPEX SPOT(opens in a new tab), Nord Pool(opens in a new tab), OMIE(opens in a new tab), GME(opens in a new tab), OTE(opens in a new tab), TGE(opens in a new tab), OPCOM(opens in a new tab), and HEnEx.
EUPHEMIA EUPHEMIA(opens in a new tab) is the algorithm that runs the pricing calculation and determines the electricity clearing prices at different times and bidding areas, including also the cross-zonal exchanges. It solves an optimization problem that aims at maximizing the welfare, in the form of economic surplus, across all bidding zones and delivery intervals in Europe; subject to the capacity constraints communicated by the TSOs, and all orders submitted to the different NEMOs, among other conditions.
The different NEMOs that form the Price Coupling Regions (PCR) co-own the algorithm and are responsible for running it every day. A private company called N-SIDE is the developer and maintainer of EUPHEMIA.
PMB: PCR Matcher and Broker Network and IT infrastructure that supports the communication between NEMOs. It handles the transfer of anonymized orders, grid constraints, bid constraints, and other information among bidding areas. Together with EUPHEMIA they are the two software pillars supporting the European Power Market.
SOB: Shared Order Book Central electronic system that gathers the continuous intraday trading orders from different NEMOs, orders them by price and time, checks cross-zonal capacities, and matches the trades following a price-time priority.
CMM: Capacity Management Module The CMM is a centralized software system that tracks and updates available cross-border capacity in real time, so the SOB has enough information to verify if a continuous trade can happen and hence match the involved orders. TSOs provide this information, as they constantly monitor the grid status and scheduled exchanges.
SM: Shipping Module It is the SIDC software that converts and transfers trades in the continuous intraday trading to scheduled exchange and transfer information required by NEMOs, TSOs, and other relevant entities.
The Big Picture
Operational Diagram
The definitions above might be too much information. They include physical institutions, abstract functionality, documents, and frameworks that not necessarily click together in a mental model. Figure 1 presents an operational diagram where all the concepts presented in Definitions & Key Players are displayed.

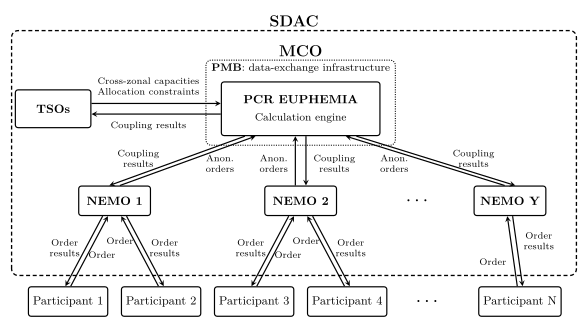
Participants are independent units, which might be private or public. They perform complex analysis, have their own forecasts, deal in parallel with diverse financial products, and run their own optimizations to increase their operational revenue. This decision making process reduces to their orders, where all their analysis concentrates into bids, and it is the manner they have to enter the electricity market.
After this independent analysis, NEMOs and TSOs take over. They are the two pillars running the entire European Power Market within the SDAC (remember this is a framework, it sets the rules of the game). NEMOs receive the orders, anonymize them, and handle the communication with the PCR EUPHEMIA algorithm. Together with the analysis of the TSOs, which is also submitted to EUPHEMIA, this produces the coupling results, which define the cross-border agreements, prices, and participants involved in the electricity generation and consumption.
This system is run by the MCO functionality, which is shared by the NEMOs. They use this function to manage and maintain the IT infrastructure, the PMB, and run the EUPHEMIA algorithm, which is maintained by the PCR consortium.
How It Works
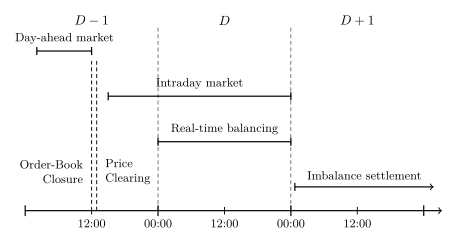
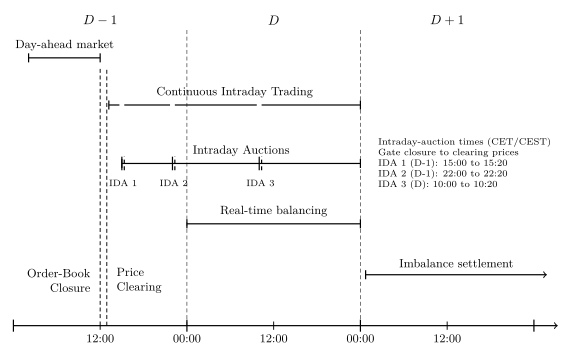
Power markets set prices one day at a time. Defining those prices takes, however, more than a day, and spans from the day before (D-1) to days (D+1), or even weeks, after the actual day where power generation and consumption occurs. As a mental model, the European electricity market decisions follow a sequential order, although overlapping occurs between some mechanisms.
Figure 2 represents the timeline of when these different events take place. As a simple, yet useful model, we can group these markets and balancing mechanisms as follows:
Day-ahead market: period of time of the previous day (D-1) where participants submit their orders to the respective NEMOs. At noon, the order book is closed and the NEMOs transfer the anonymous orders to the MCO so EUPHEMIA runs the pricing calculations and produces a result that is communicated back. Once the NEMOs verify the calculations are correct, the day-ahead prices are accepted and each NEMO communicates the coupling results to the different entities that submitted an order. This establishes a binding contract to produce or consume power and cannot be modified anymore. This is important, the intraday market and the different balancing mechanisms occur in addition to the day-ahead decisions, they do not modify existing day-ahead agreements. Note also that these coupling results force the participants to consume or provide the agreed energy in the respective bidding zone at a particular time. If for any reason any of the participants cannot meet its orders, it should try to balance them during the intraday market. If imbalances still occur, they are handled via the imbalance settlement.
Intraday market: once the NEMOs accept the day-ahead results, the different participants start negotiating new agreements. This occurs because they get progressively more information, e.g. forecasts change, portfolio optimization leads to new results, or different financial products have been traded. The intraday market is an umbrella that covers several mechanisms to reach an agreement of purchasing or selling power in different bidding zones at different times. For instance, participants can be part of intraday market auctions, or can bilaterally sign buy/sell power contracts. Just to reinforce this idea, none of these agreements change the day-ahead results; they are used to balance out power portfolios, energy mismatches, and improve the financial operation of the market participants.
Real-time balancing: set of mechanisms that the TSOs utilize to ensure that the generation meets the demand everywhere at all times while keeping stable frequency in the grid. TSOs have agreements with different participants, on both generation and demand sides, that allow modifying their operation to keep a balanced grid. Therefore, real-time balancing is tightly connected to the power system operation, and can only happen during the time that power is being consumed and produced (day D).
Imbalance settlement: despite all the balance mechanisms described above, there are always small imbalances. Some participants could have produced slightly more or less than agreed. Once the day in scope, day D, is finished, the metering information is gathered and the power allocation is reviewed. With this information of what truly happened, imbalance settlement calculations are carried out to close the financial results of the different participants. These calculations can take days or even weeks depending on the case.

Day-Ahead Market
The day-ahead market refers to the process where orders submitted by participants to the NEMOs, and cross-zonal capacities and allocation constraints from the TSOs are combined in a pan-European optimization that results in zonal prices, order approval and rejection, and scheduled power exchanges. Figure 3 represents this process.

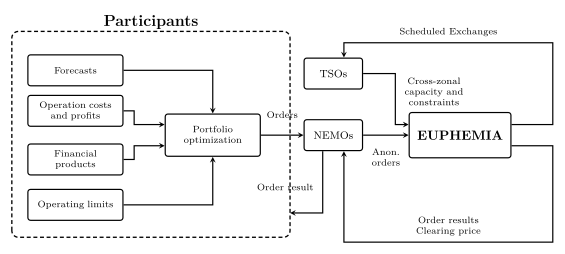
Before submitting an order, participants run complex analysis to determine the optimal electricity they want to buy or sell in a particular bidding zone at a specific time interval. These studies might involve forecasts for power generation and demand, electricity prices, contracts with other customers (e.g. aluminum plants that must satisfy contractual supply, or utility companies providing electricity to consumers), financial products like Contracts for Difference (CfDs) that might exist to leverage or compensate risk, and any engineering limits associated with operation of a particular asset.
Regardless of the complexity and the inputs of this analysis, the output is always an order (or the lack thereof). These orders differ depending on the participant and can include several conditions with different degrees of complexity. Some participants can submit block orders that span several MTUs, while others might deliver many orders with distinct conditionals for different MTUs at different electricity quantities.
Once the decision is made, participants submit their orders to a NEMO. These entities are responsible for anonymizing the orders and transferring them to the market calculations run by the EUPHEMIA algorithm. Participants can choose their NEMO as there might be different alternatives depending on the bidding zone. See Table 2 for a detailed list of the NEMO options.
In parallel, TSOs also run analysis of their transmission infrastructure. Forecasts, transmission capacity and topology, equipment status, maintenance schedules, reserve agreements, reliability margins, and many other factors become part of the decision making process that results in the cross-zonal capacity and allocation constraints for different bidding zones. In essence, this information tells EUPHEMIA how much import and export each zone can handle and the allowable flow across zones.
Grid operational constraints, cross-zonal capacities and zone congestions are extremely important for the clearing prices. Each bidding zone is characterized by a unique price every MTU. If the grid has enough capacity, electricity can flow across zones, which allows sharing a common price. However, when the grid is congested, cross-zonal exchanges are at their limit and cannot be increased, so price differences among bidding zones appear.
EUPHEMIA, the algorithm performing the centralized optimization, gathers the anonymized orders from the NEMOs and the TSOs' cross-zonal capacity and allocation constraints to formulate an optimization problem that considers orders and bidding zones for most of Europe. The order-book closes at noon, setting the time for the start of the calculation. Results are then shared with the NEMOs for verification. When all NEMOs accept the EUPHEMIA results, the clearing prices for the day-ahead market are set for the different zones at all the 96 MTUs of the next day. Moreover, these results also define the scheduled exchanges across bidding zones and which orders are accepted and rejected. NEMOs communicate individually to each participant the result of its order. This sets the end of the day-ahead market and starts the intraday market.
Intraday Market
The day-ahead market is the unique price-making mechanism that allows participants to submit orders and take positions based on the centralized EUPHEMIA calculations. It creates accepted trades at specific bidding zones and MTUs. The intraday market allows participants to update these positions by placing cumulative orders.
In contrast to the day-ahead market, which is a unique, central process; the intraday market covers different mechanisms to make purchases and sales. There are several ways of trading in the intraday market, which are covered by the Single Intraday Coupling (SIDC) European framework, being the main two price-making mechanisms:
Intraday auctions
Continuous intraday trades
Regardless of the method, the new purchases and sales in the intraday market do not modify the day-ahead positions. They are added to the previous accepted orders and trades. Therefore, the net position of a participant is:
In this simplification E represents the traded energy, and Eother trades covers any other bilateral agreements, local products, and regional auctions. If there are any deviations in terms of consumption or generation from the net final position, the imbalance settlement handles the financial difference.
Continuous Intraday Trading
Continuous trading works like a financial exchange. There is an order book where participants place orders through their NEMOs, either buy or sell. When these orders match, meaning that a participant is willing to buy at a price equal to or higher than another participant wants to sell, the cross-zonal exchange capacity is checked and, if available, the trade is executed. Therefore, the continuous intraday trading mechanism consists of these steps:
Order submission Similarly to the day-ahead market, participants submit orders to their respective NEMOs. These orders specify the bidding zone, the number of MTUs and time interval, the power purchased/sold over each MTU, limit price, and any other special conditions. As an example, consider that a participant can place an order with the following characteristics: buy 10 MW over 2 MTUs from 18:00 to 18:30 at a maximum price of 50 €/MWh. This means that this participant wants to buy:
10 MW · 0.25 h/MTU · 2 MTU = 5 MWhover the full period included in the order. The maximum price willing to pay for this energy would be 250 €.
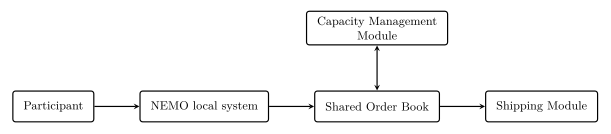
Order transfer to the Shared Order Book (SOB) NEMOs receive the continuous trading orders from the participants, verify that they are correct, and transfer them to the SOB. The SOB acts as a central platform that gathers orders from different NEMOs, not necessarily in the same bidding zone.
Order matching based on price-time priority As orders arrive at the SOB, they are matched with each other. This means that the trading software continuously checks if there are buy and sell orders where their delivery period, quantity and price can make the trade occur. Order matching happens when the buying price is equal to or higher than the selling price and there is enough energy and cross-zonal capacity (if the trade is between different bidding zones). The SOB matching process follows a strict set of priorities: 1- Price: the orders with the highest buy and the lowest sell prices come first. 2- Time: if there are two orders with the same price, the order that was received first has priority. The price at which the trade happens is defined by the resting order, which is the technical term to define the order of the trade, either buy or sell, that was placed first. Continuing the example above, consider that there is a sell order of 20 MW from 18:00 to 18:30 at 40€/MWh. This is the resting order in the example. Then, the buy order of 10MW that is placed afterwards at 50 €/MWh executes, being the final price 40 €/MWh, assuming they are in the same bidding zone or there is enough cross-zonal capacity. However, if the sell order was only for 5 MW, and there was another sell order for 20 MW at 45 €/MWh, then there would be two trades (assuming they are doable), 5 MW at 40 €/MWh because it was the resting order and another 5 MW at 50 €/MWh, because the second sell order came later than the buy order, and hence the buy order became the resting order. The second sell order would only be partially executed, as only 5 MW of the buy order remains.
Cross-zonal capacity checking Before confirming a trade that involves different bidding zones, the SOB must verify that there is enough cross-zonal capacity, otherwise there would not be a physical mechanism to exchange the traded power. This information is requested by the SOB to the Capacity Management Module (CMM), which gathers all cross-zonal transmission capacities from the TSOs and communicates the latest capacities and updates. If there is enough capacity, the SOB can move forward with the trade; if there is not, the trade is not accepted even if the pricing matches and the order matching process must consider other orders following the set of priorities listed above.
Trade shipping Once the trade happens in the SOB, it must be communicated to the relevant parties. Shipping refers to the process followed by the Shipping Module (SM), where the trade, including the cross-zonal exchanges, is transferred in appropriate formats to NEMOs, TSOs, shipping agents and any other relevant entities.
Overall, the continuous intraday trading is a sequence of actions that boil down to an order book process that follows a set of priorities, pricing and timing, provided the cross-zonal capacities are sufficient. Because of this continuous, dynamic nature, the continuous intraday trading mechanism does not have a clearing price. The SIDC process is summarized in Figure 4:

Intraday Auctions
This intraday price-making mechanism is much closer to the day-ahead market. It follows the same approach where participants submit orders to their NEMOs until gate-closure, who anonymize them and transfer to EUPHEMIA, which gathers all of them together with the allocation constraints and cross-zonal capacities from the TSOs and produces the coupling results. The main differences between the intraday auctions and the day-ahead market are the frequency at which they occur and the interaction with the continuous intraday trading.
Intraday auctions happen three times per day. Table 3 summarizes the gate closure for each auction and the time interval that can be traded at each one. Note that two out of the three auctions occur the day before, which is a bit counterintuitive. When these intraday auctions occur, i.e. some time before gate closure and a few minutes after the coupling results are approved, the cross-zonal capacity allocation through continuous intraday trading is blocked. The reason behind this decision is to prevent the same cross-zonal capacity from being allocated simultaneously by the continuous market and the intraday auction. Once the intraday auction is finished and the clearing prices for the different bidding zones and MTUs are approved, the CMM is updated and the continuous intraday trading can continue.
| Auction | Gate closure | Delivery periods covered |
|---|---|---|
| IDA1 | 15:00 on D−1 | All of delivery day D |
| IDA2 | 22:00 on D−1 | All of delivery day D |
| IDA3 | 10:00 on D | 12:00–24:00 on day D |
Considering the three intraday auctions, Figure 5 presents the resulting timeline for a single day, D, in the European Electricity Market:

Continuous Trading vs Auctions
As one can realize at this point, the two main intraday mechanisms differ greatly. Continuous trading and the auctions are both based on orders; however, these are executed following distinct processes and algorithms. Table 4 provides an overview of the main differences between continuous trading and intraday auctions.
| Characteristic | Intraday auctions | Continuous intraday trading |
|---|---|---|
| Trading method | Orders accumulate and clear together | Orders match immediately when compatible |
| Main algorithm | EUPHEMIA | SIDC continuous matching algorithm |
| Price | One zonal clearing price per MTU and auction | A separate transaction price for every trade |
| Network allocation | Optimized jointly with all auction orders | Allocated trade by trade |
| Cross-zonal capacity price | Scarcity is reflected through zonal price differences | Capacity is allocated at zero price, first-come-first-served |
| Timing | Three scheduled auctions | Runs between auctions until gate closure |
| Main advantage | Concentrates liquidity and allocates scarce capacity efficiently | Allows participants to react immediately to new information |
| Main limitation | Participants must wait for the auction | An early trade can consume capacity that a later, more valuable trade could have used |